Point Densometer
Point Densometer is a python script creating
a visual density-representation of the distribution of an irregular group
of geodetic points (point-cloud).
Those points have probably been determined by terrestrial surveying
to be used for a TIN.
The script reads in a text-file with coordinates. It sorts those
coordinates in a grid with a certain raster width. The amount of
coordinates in each grid-rectangle (usually a square) is than represented
by a certain colour value. The resulting image is not meant for reading
out discreet values. It is supposed to give a general overview.
You need a certain amount of coordinates, in order to get meaningful
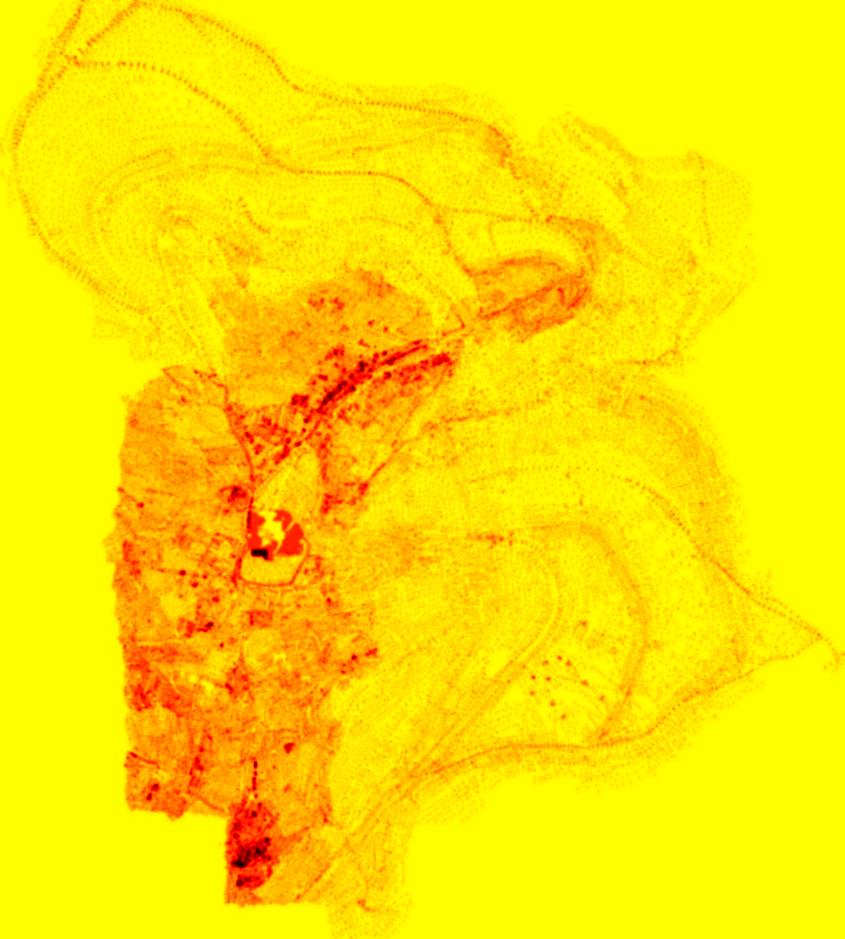
results. The following image was created with more than 80k points:

Example result for Mont Beuvray: 2m/px in full version
One can see the higher density of survey-points along the walls surrounding the hill.
The highest density is of course to be found in the center of the celtic settlement,
especially around the traces of buildings.
The script really only creates a gray-scale picture. I used the
GIMP to lay a color-gradient over the
raw-picture after bluring it a little bit. I tried my luck with some
image-enhancing algorithms to no real success. I recommend using filters
from your favorite image-processing program - which is just so much more flexible.
You should not grab discrete values out of the picture anyways - it is meant to
give the big picture and a general overview.
If you have ever read in a coordinate list in a program of yours, you should
easily be able to adjust this script to any coordinate file which stores
one point per line - even if you have never worked with the
python language before.
Prerequisites:
Download:
densometer.py (version 0.1)
The program is GPL'ed.
Other:
If you need a coordinate-file to play with, contact me.
The script resulted as a by-product during my work for the
GeoTopoCart
project.
Another script that has its origin in that project is
pointdivider.pl, which is written in
perl, causes brain-damage from looking at the code,
is only commented in german, slow and uneffective as hell, but can be used to
divide the points in a big coordinate-file, into many separete files, for each
200x200 meter quadrant.
← home